 By Tom Shapland, PhD, July 27, 2020
Last summer, I was talking to a viticulturist about the water stress level of one of his blocks.
“The midday leaf water potential says 14 bars, but it is 104 degrees out,” He said. “It’s probably more like a 12. I’m not going to irrigate yet.”
I’ve heard many growers make similar statements. Vapor pressure deficit, which is a measure of the dryness of the atmosphere and tends to increase during high temperature events, has a strong influence on pressure chamber readings. The phenomenon is well-documented in the academic literature and commonly observed among grape growers. Like the viticulturist I was speaking to last summer, many growers intuitively adjust their pressure chamber readings on hot and dry days. But even the most talented viticulturists have a story about getting a 16 bar reading on a hot day, turning the water on in a panic, and later regretting the decision.
The tree nut industry adjusts pressure chamber readings for the influence of vapor pressure deficit as a standard protocol. The method tree nut growers have adopted from academia requires learning a new scale (i.e., 6 bars is the new 14 bars). I think the grape industry has been reluctant to adopt a similar VPD correction because the existing scale is deeply entrenched in viticultural practices.
Here is an approach to correcting pressure chamber readings for the influence of VPD that preserves the existing scale.
- First, we determine the baseline VPD. The baseline VPD is the typical VPD for the time of day and the time of year for a particular region.
- Next, we compare the VPD at the time of the pressure chamber reading to the baseline. If the VPD at the time of the reading is higher than the typical VPD (i.e., higher than the baseline), then we would expect the pressure chamber to show too much stress.
- Then, we calculate how much the elevated VPD is influencing the pressure chamber reading.
- Lastly, we remove the influence of VPD from the pressure chamber reading.
In the past, I haven’t concerned myself much with this issue and other issues with the pressure chamber. It would be like performing CPR on a pterodactyl. If the cardiac arrest doesn’t kill it, then surely the asteroid will. Labor costs will soon enough exterminate the pressure chamber. But the pressure chamber is something of the gold standard in the grower community, so let’s endeavor to improve our use of the device.
Moreover, the dinosaur-slaying asteroid that Tule created, Tule Vision, already corrects for the influence of VPD. The Tule Vision model was trained on FieldStat readings from our sensors, and FieldStat measurements are corrected for the influence of weather. If you want to compare Tule Vision readings to pressure chamber readings, then you will need to correct the pressure chamber for the influence of VPD.
Method
Determine The Baseline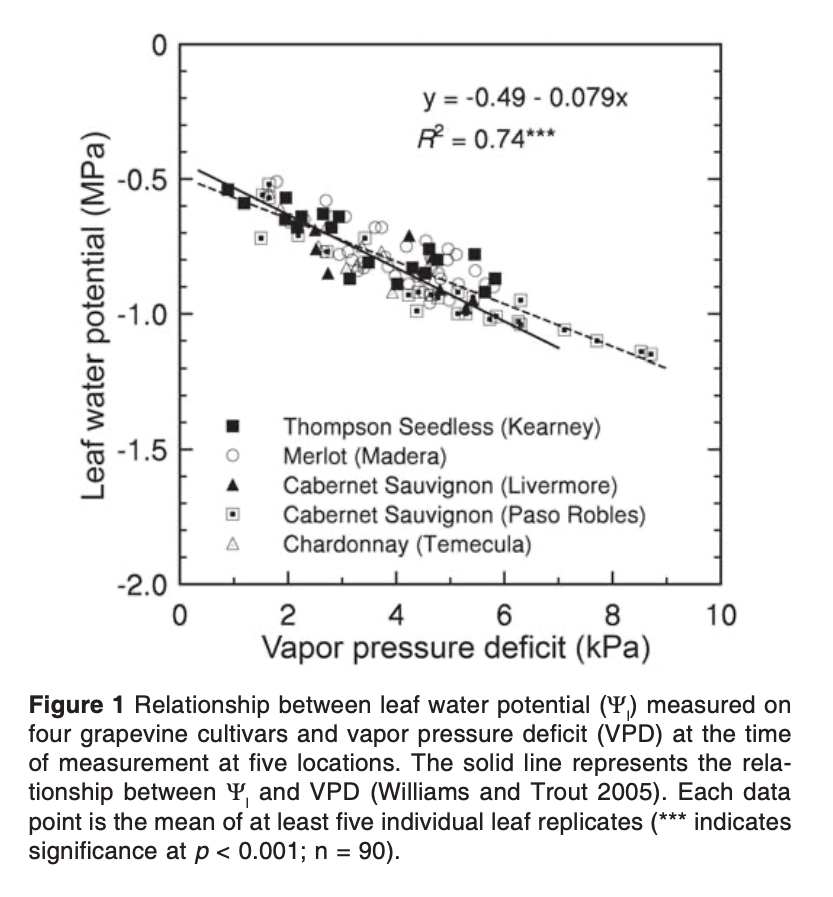
The above figure from Williams and Baeza 2007 shows the relationship between midday leaf water potential and vapor pressure deficit for vines without water stress. Note that the leaf water potential units are in megapascals. Because most growers speak of water potential in terms of positive bars, I will use the same convention. The figure tells us, “For vines without water stress, you will get a leaf water potential of 5 bars when the VPD is very low (i.e., generally the air temperature is cool), and you will get a leaf water potential of 12 bars when the VPD is very high (i.e., generally the air temperature is hot).
Depending on the weather, your pressure chamber readings can be off by up to 7 bars.
This reminds me of something else I once heard a grower tell me. “I don’t use the pressure chamber because it’s just a labor-intensive way of checking the weather.”
The baseline VPD should be region specific because one grower’s high VPD event may be another grower’s routine VPD. If you farm in an area where the VPD is always at a high value (e.g., 6 kPa), then you are used to what the pressure chamber readings say for 6 kPa conditions. That is, you have calibrated your interpretation of the pressure chamber for the local conditions. When you get a 12 bar reading, you know that, where you farm, 12 bars means the vines are still looking lush. But for another grower, who farms in a milder climate where the VPD is typically around 2 kPa, 12 bars means the vines are showing more stress and it’s time to turn on the pump.
During any particular day, the highest VPD tends to correspond to the highest air temperature. That is, the VPD changes throughout the day. Also, VPD changes throughout the year. The highest VPD on a typical day in May is lower than the highest VPD on a typical day in August. Therefore, in addition to being region specific, the baseline VPD should also be specific for a time of day and specific for the month.
For our baseline VPD, we take the last three years (2017, 2018, and 2019) of VPD data for one location per California county. We use CIMIS data because it’s readily available to everyone on the internet. We calculate the average VPD over the last three years for June at 10 am, for June at 11 am, for June at 12 pm, and so on. We run the calculation for the hours of x am to y pm and for the months of June through September. The result is the average VPD for a region for a particular time of day and for a particular month.
Calculate the Baseline VPD and the VPD at the Time of the Pressure Chamber Reading
For the next step, we want to see how much higher or lower the VPD is from the baseline VPD. This is a fairly straightforward calculation. We calculate the baseline VPD for the time of day and month of year that we took the pressure chamber reading, as described in the previous section. Next, we calculate the VPD at the time of reading. If you’re unsure on how to make these calculations, then you can request a copy of our sample Excel file.
Calculate the Influence of VPD on the Pressure Chamber
Rather than taking an intuitive guess at how much error VPD has caused in the pressure chamber reading, let’s put some numbers to it. Let’s start with the regression model that Williams and Baeza developed for relating VPD and leaf water potential (LWP) in the figure above.
Equation 1.
LWP = -0.49 - 0.079 * VPD
We can take this equation, and use it to see what the LWP would be at our baseline VPD and what the LWP would be at the VPD of the time of the pressure chamber readings.
Equation 2.
LWP_bomb_time = -0.49 - 0.079 * VPD_bomb_time
Equation 3.
LWP_baseline = -0.49 - 0.079 * VPD_baseline
We want to know how much the current VPD increased or decreased the LWP compared to the baseline. If we know the influence of the VPD on the reading, then we can use it to correct our leaf water potential reading.
Equation 4.
LWP_error = LWP_bomb_time - LWP_baseline
If you substitute equations two and three into the right side of equation four, then the intercept term (i.e., -0.49) drops out, and you get this.
Equation 5.
LWP_error = -0.079 * (VPD_bomb_time - VPD_baseline)
The above equation would give us the leaf water potential in negative megapascals. Growers speak of leaf water potential in terms of positive bars, so the error looks like this in terms of bars.
Equation 6.
LWP_error = 0.79 * (VPD_bomb_time - VPD_baseline)
Remove the Influence of VPD from the Pressure Chamber Reading
We know the error that VPD caused in the pressure chamber reading. Let’s subtract the error from the pressure chamber readings to get the corrected reading.
Equation 7.
LWP_corrected = LWP_bomb_time - LWP_error
A hypothetical vine, a hypothetical intern, and a data-savvy viticulturist
Let’s imagine we have a vine in Napa where the actual leaf water potential is always 12 bars. The hypothetical vine always stays at 12 bars, no matter how much water it gets.
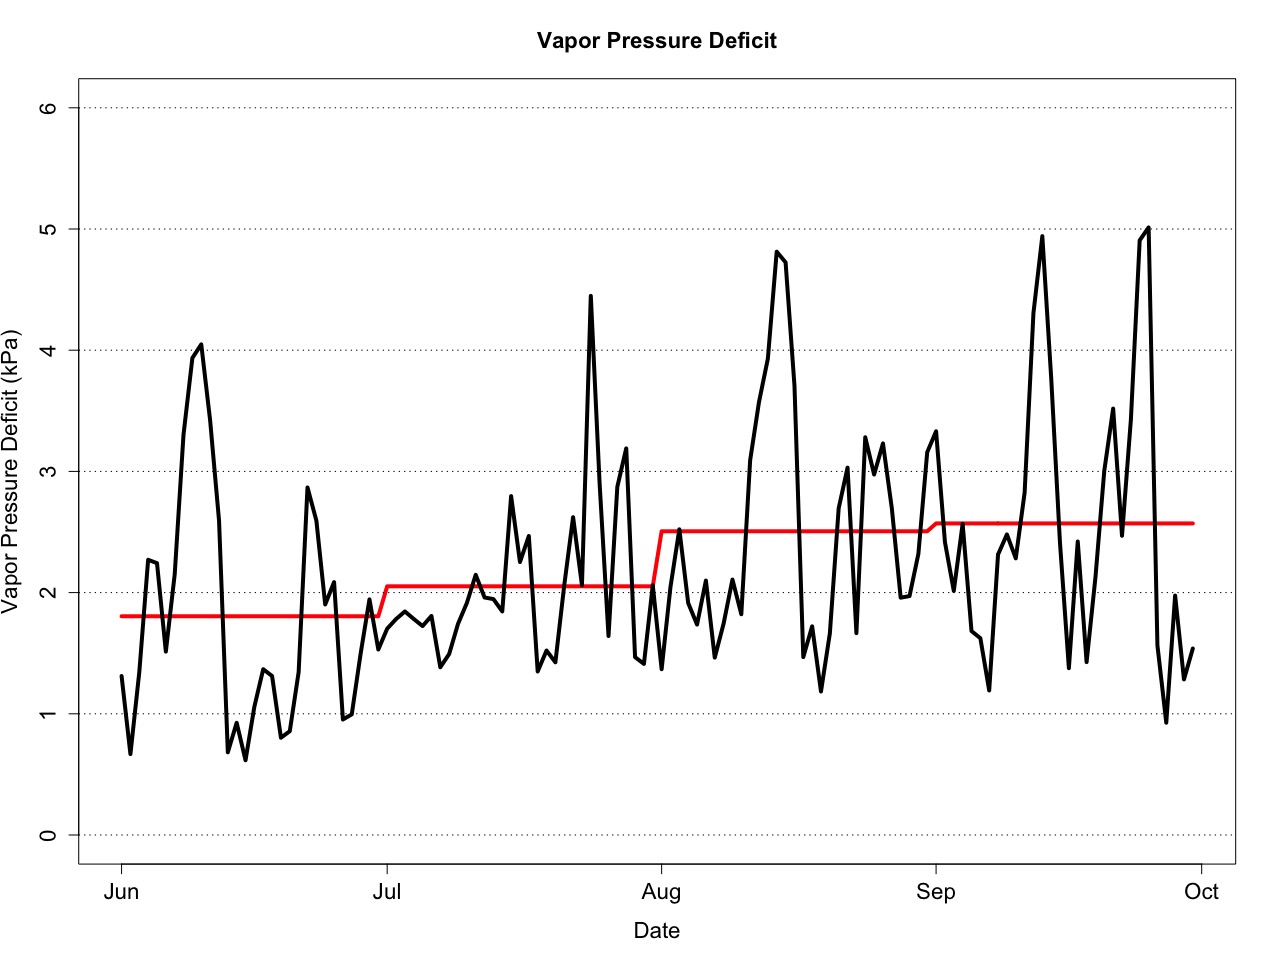
In the above figure, we have the baseline VPD in Napa County at 3 pm Pacific Daylight Time (2 pm Pacific Standard Time) for the months of June through August in red. We also see the actual VPD at 3 pm PDT in Napa for June 2019 through September 2019 in black.
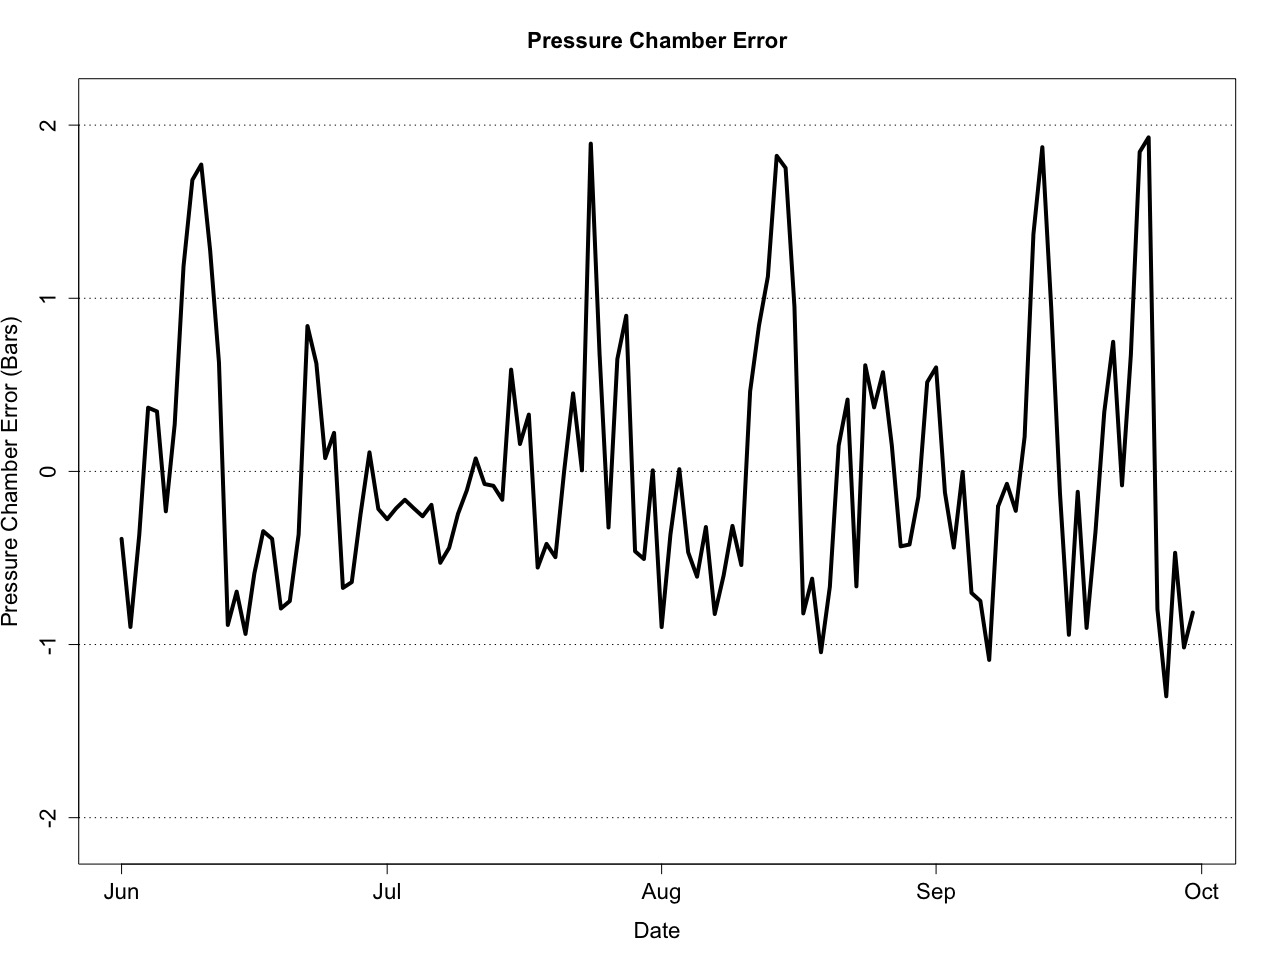
Using "Equation 6" above, the figure above shows the error caused by the influence of VPD.
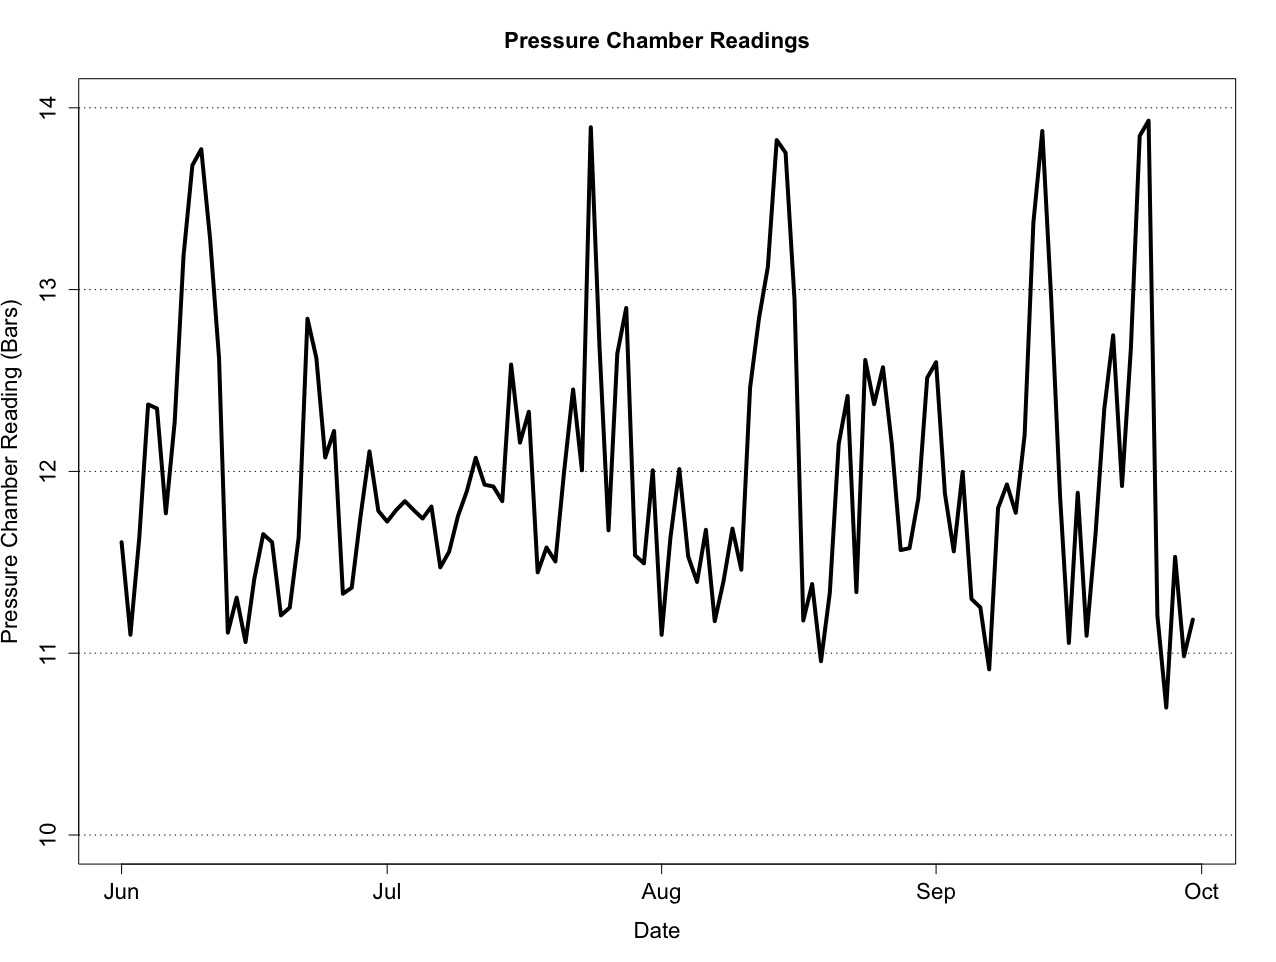
If you were to send your hypothetical intern out to take pressure chamber readings of this hypothetical vine every day at 3 pm PDT from June through September in 2019, the above figure shows the readings he would get.
Even though the vine is actually 12 bars every day, that is not what the pressure chamber tells your hypothetical intern. On September 7, 2019, your hypothetical intern gets a pressure chamber reading of 11. Your hypothetical intern looks at the value, looks at the vine, and puts his hand to his brow to soothe his hangover (“3 pm! I can’t drink like I used to.”, he says to himself. “Being 23 is the worst.”). On September 13, 2019, your hypothetical intern gets a 14. Perplexed, he writes 12 down on his clipboard, finds some air-conditioned bar, and spends the rest of the afternoon contemplating a career in banking.
You take your hypothetical intern’s readings, and you decide you’re going to correct the values for the influence of VPD. You requested a copy of our sample Excel file that has the baseline VPD values and above calculations in it. You go to the CIMIS website to look up the air temperature in Celsius and vapor pressure in kPa for your county. You enter the weather data and pressure chamber readings into the spreadsheet, and, as expected, you get 12 bars.

But wait, what about the influence of water stress on the influence of VPD on pressure chamber readings?
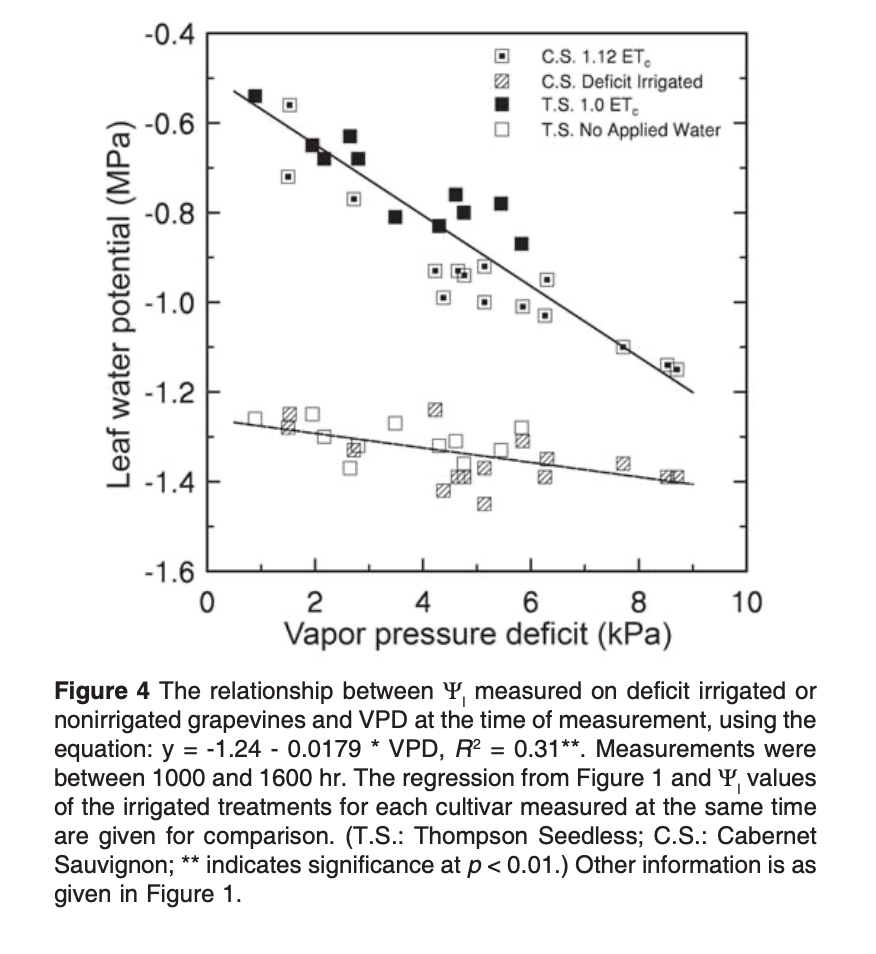
The above figure from Williams and Baeza 2007 shows that the relationship between VPD and leaf water potential changes with water status. In other words, the water status of the vines influences the pressure chamber error caused by VPD. The more water-stressed the vines, the less the VPD influences the pressure chamber reading.
This blogpost presents a method for correcting pressure chamber readings for the influence of VPD. It is a starting point for trying to quantifiably correct the pressure chamber. To correct the pressure chamber more rigorously, you would first need to know the water status of the vines. And that’s quite the quandary, isn’t it? To use the pressure chamber to get the water status of the vine, first you need to know the water status of the vine... so that you can correct for the influence of VPD on the pressure chamber reading.
You’re in a vineyard, standing in the sun. It’s 104 degrees and the VPD is 6 kPa. You’re staring at the petiole of a leaf in your pressure chamber. You’re wondering how you can get the water status of the vine, so you can use the pressure chamber to get the water status of the vine. Just then, your hypothetical intern walks down the vine row towards you. He’s dressed like a banker, and he’s wearing a Panama hat. You rest your hand on the pressure chamber. He puts his hand on your shoulder.
“This dinosaur is never gonna make it,” he says. “Just get yourself Tule Vision already.”

